City of Cape Town MarkData survey results — Elections 2026.

eNCA Election Command Centre
CAPE TOWN
MarkData survey 2026
Opinion survey · Not official IEC election results
| 1Voting intentions | 2Municipal performance |
| 3Mayoral preferences | 4Gang violence |
| 5N2 wall proposal | 6Key insights |
Panel 1
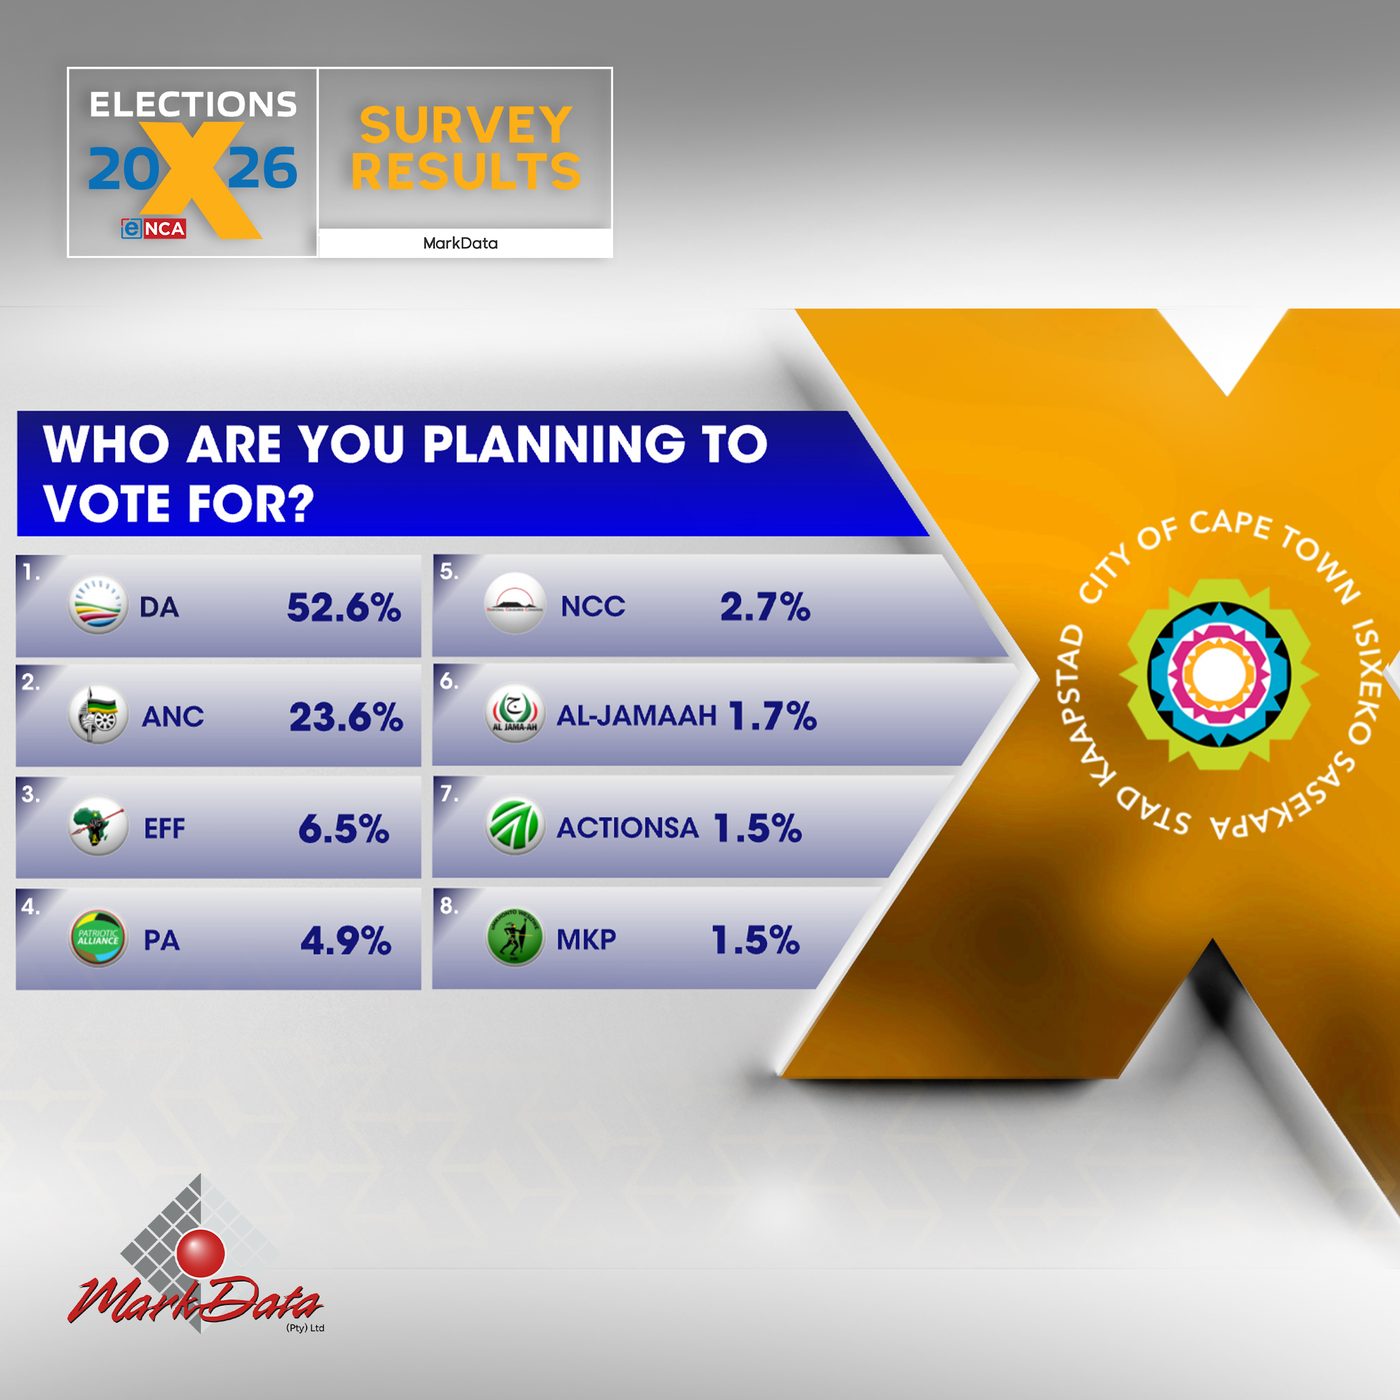
Voting intentions
Who respondents said they plan to vote for in the coming local elections. MarkData survey responses — not IEC results.
Panel 2
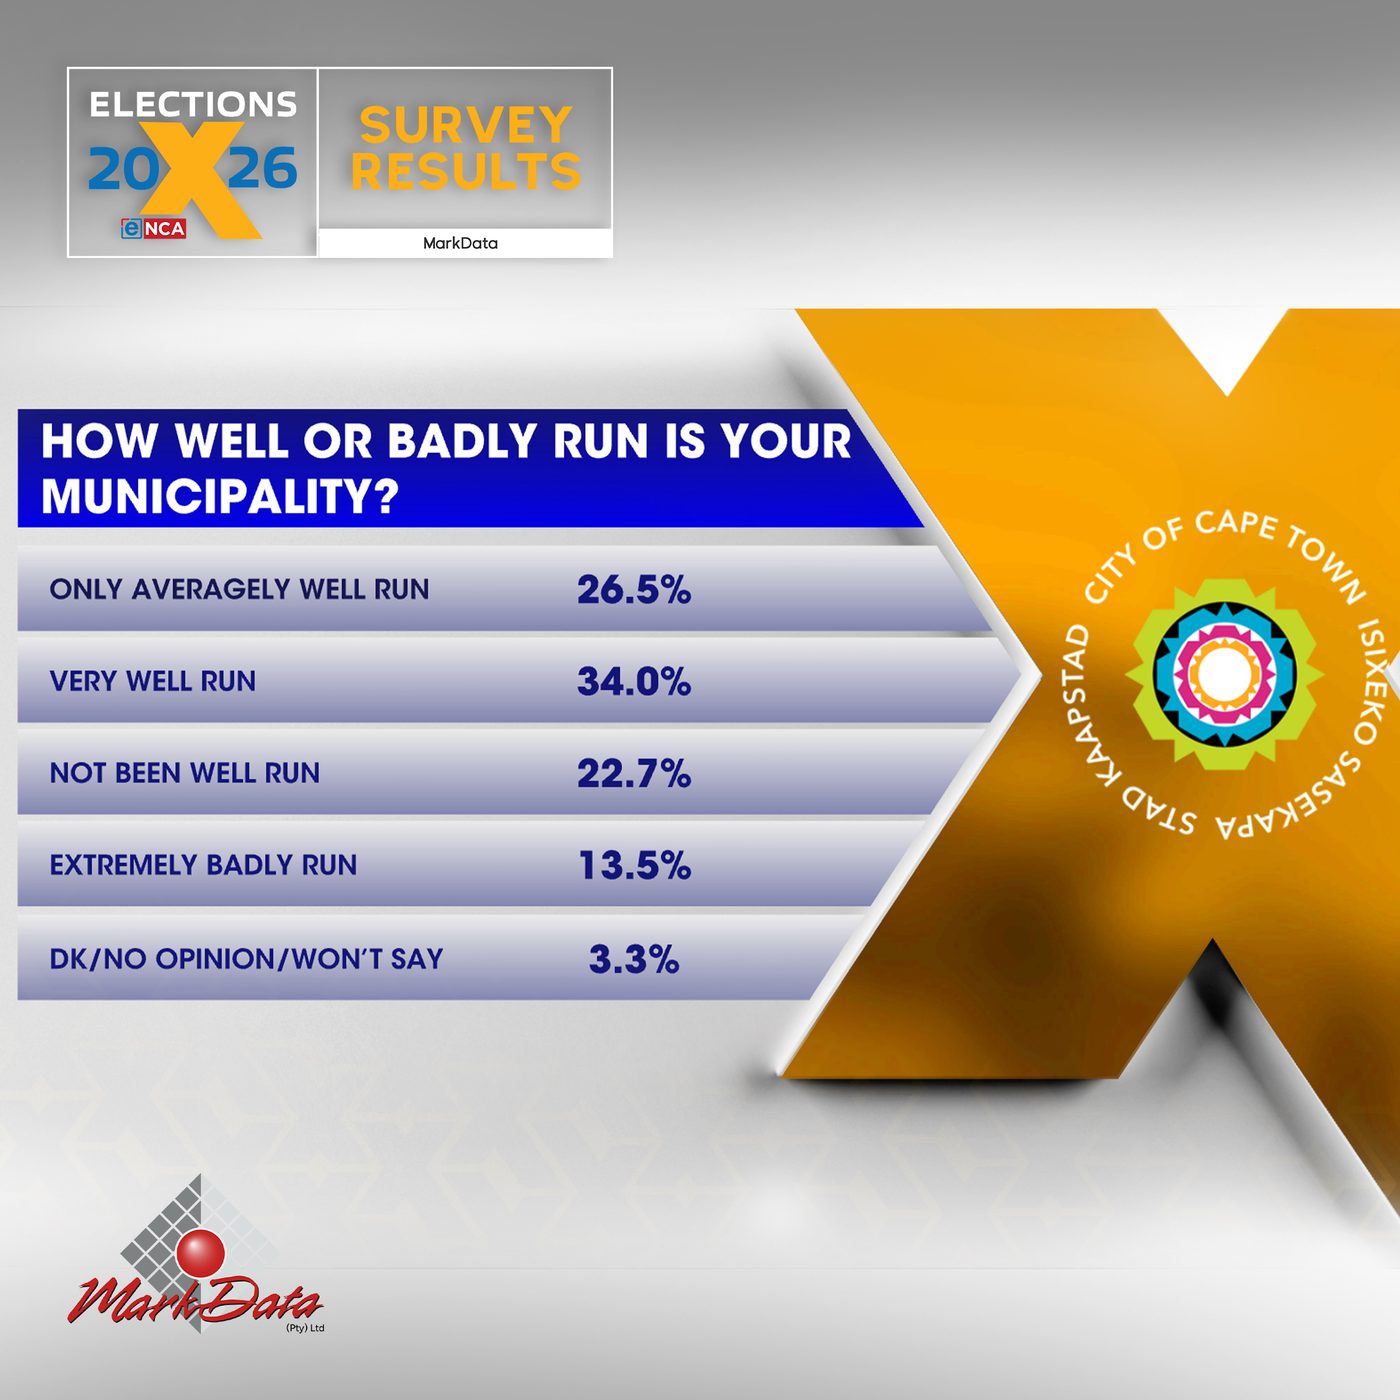
Municipal performance
How respondents rated how well or badly the municipality has been run over the last five years.
Panel 3
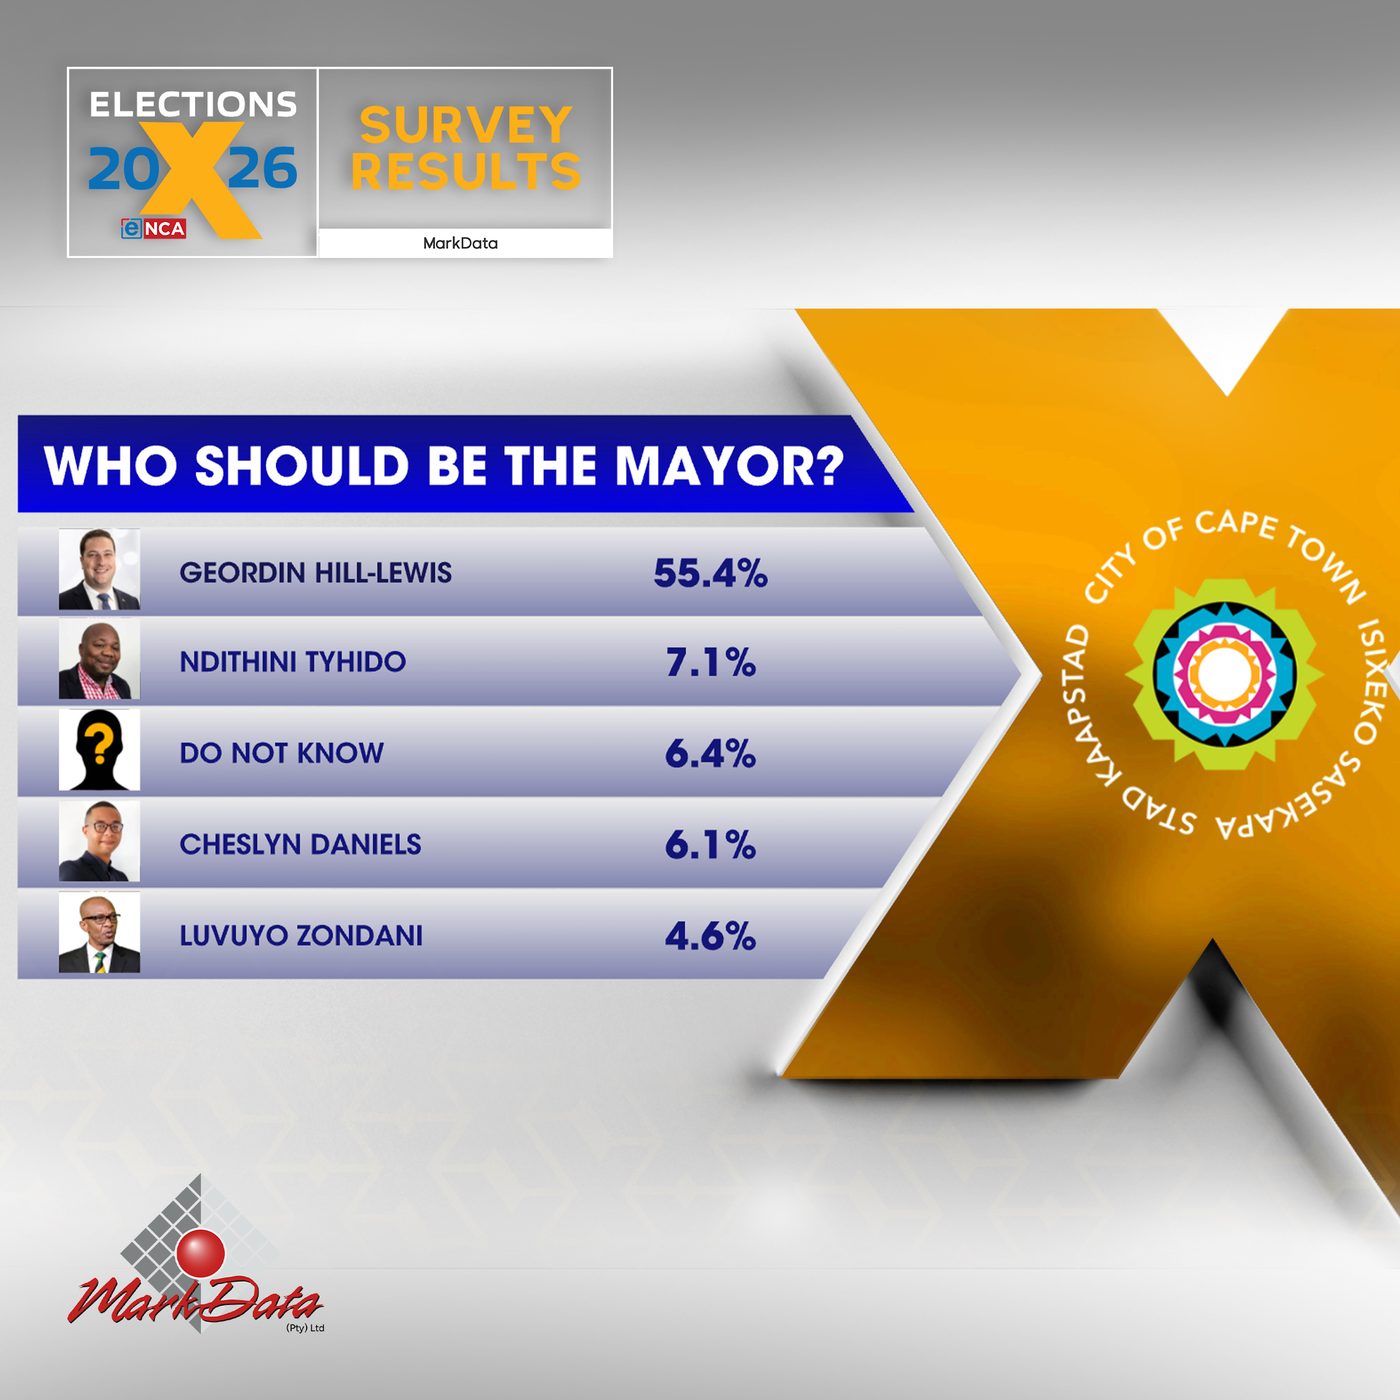
Mayoral preferences
Who respondents named as the ideal mayoral candidate to lead the metro after the elections.
Panel 4
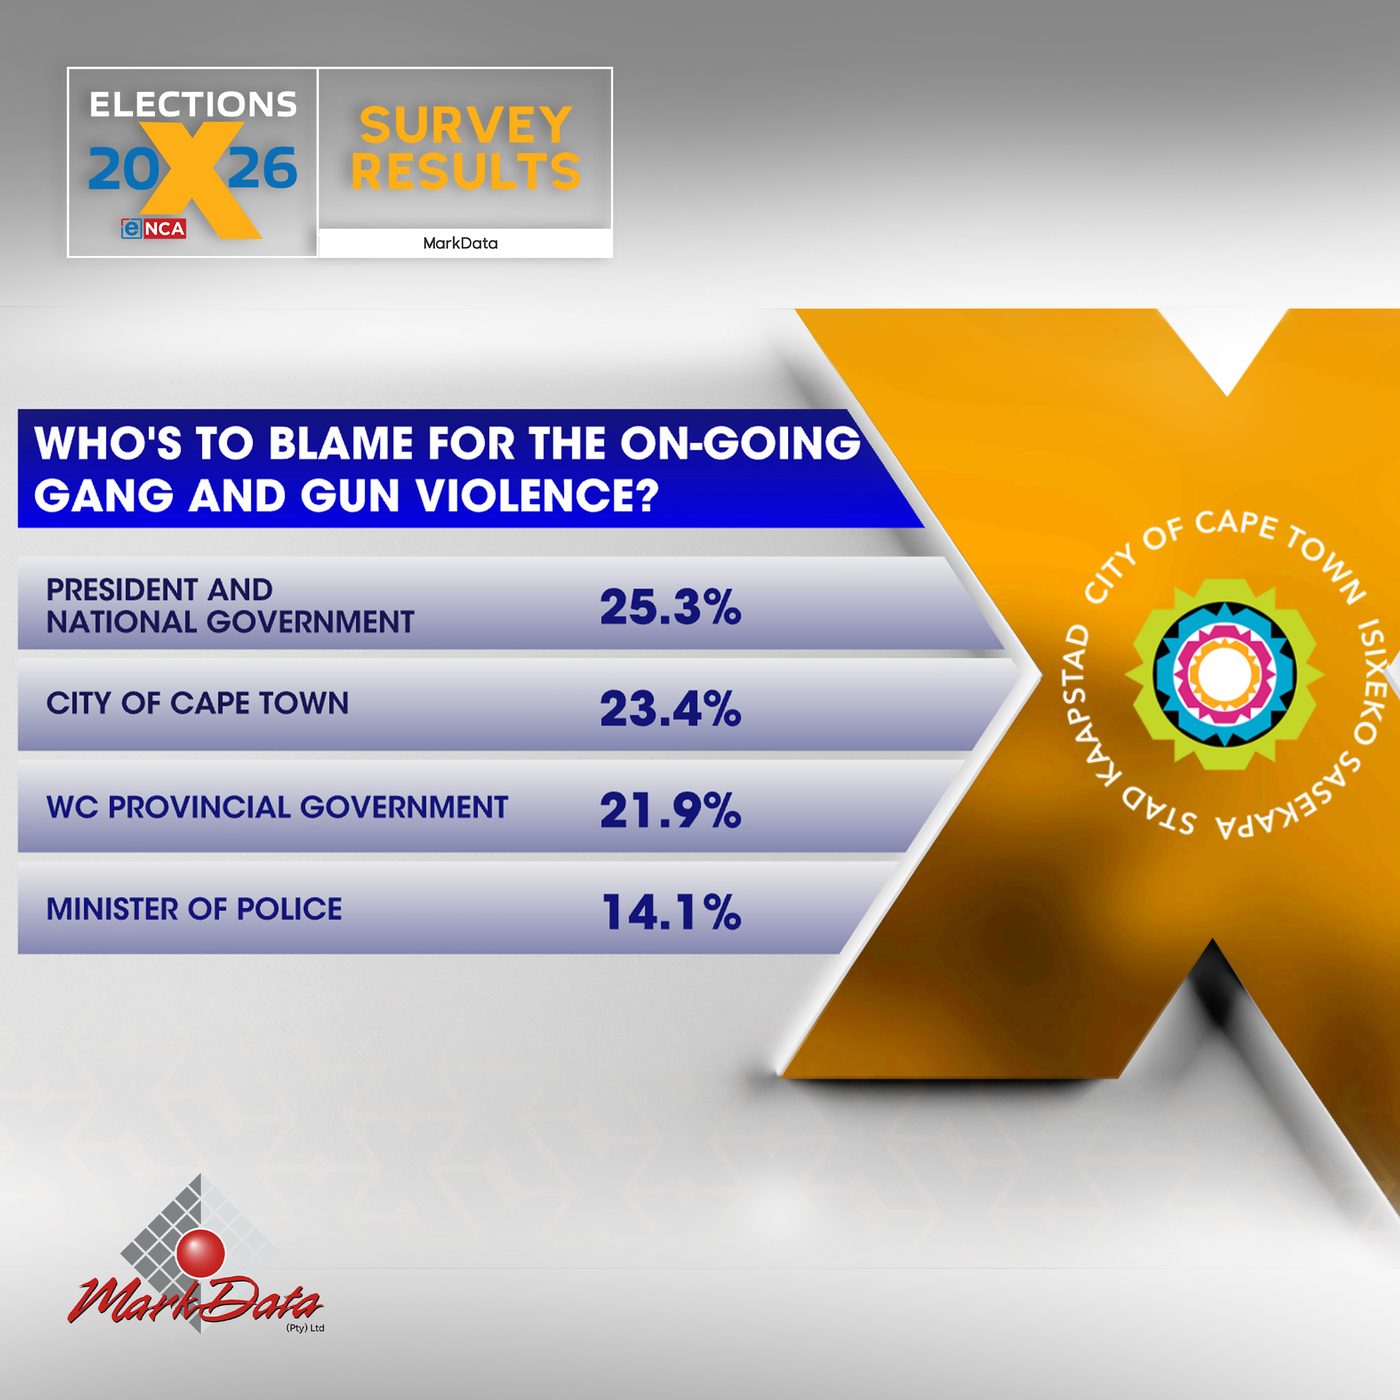
Gang & gun violence
Who respondents blamed for ongoing gang and gun violence in Cape Town.
Panel 5
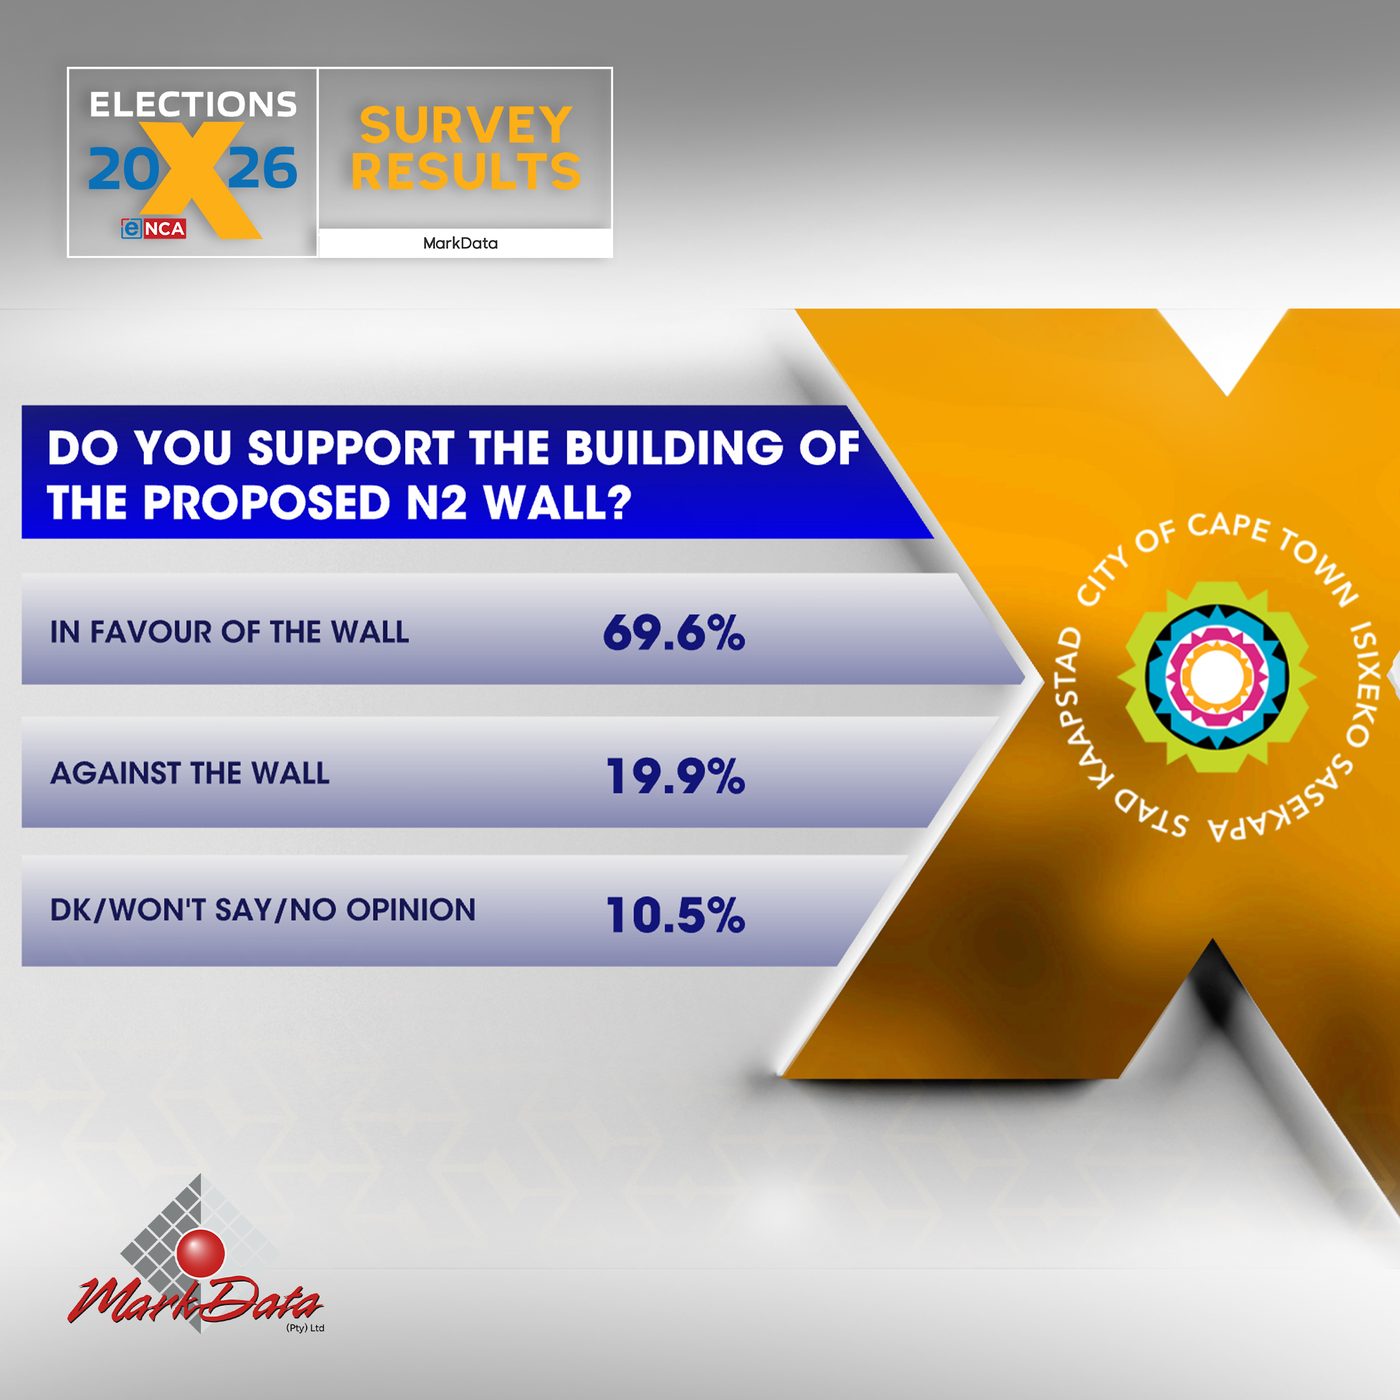
N2 wall proposal
Support for the proposed wall next to the N2. MarkData survey responses — not a referendum result.
Key insights
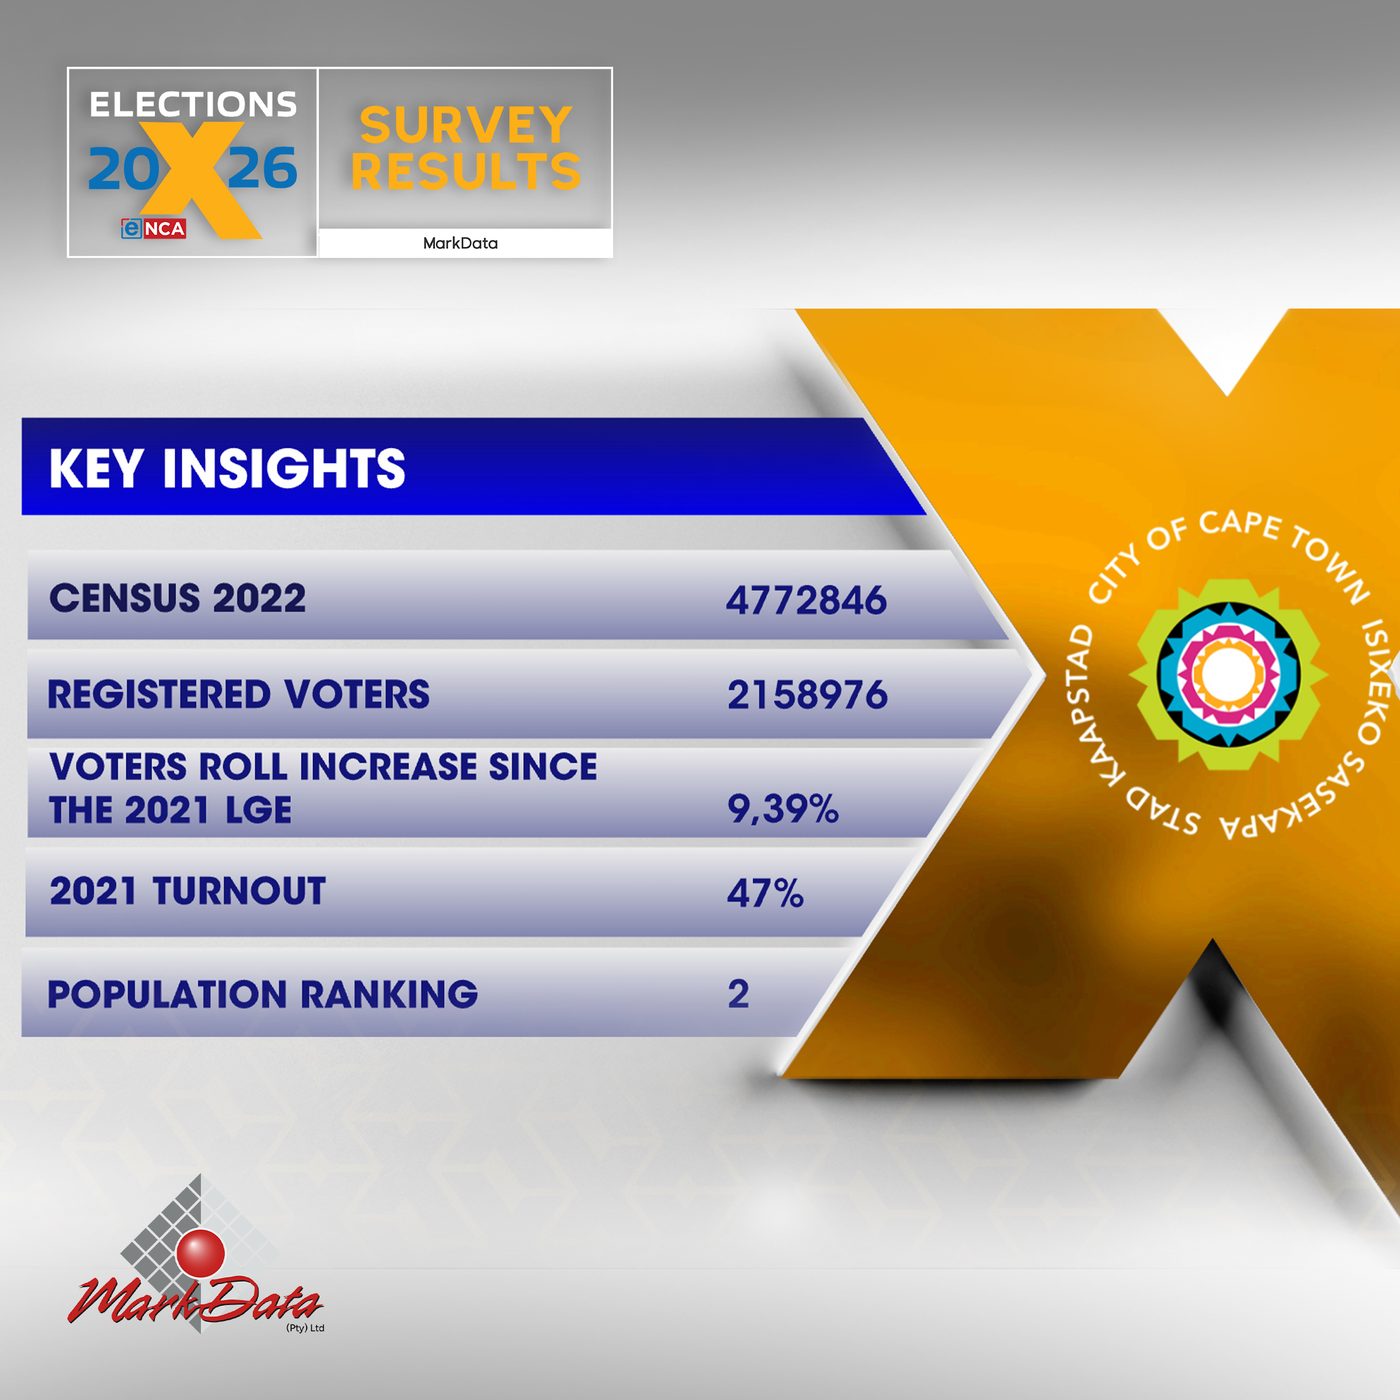
Cape Town context
Census 2022 population, registered voters, roll growth since 2021, turnout and population ranking — from the MarkData key-insights graphic.
Survey methodology
Conducted by MarkData for eNCA. Fieldwork 12 August – 10 September among about 1,000 registered voters per metro who intend to vote. Cape Town margin of error reported as ±3.09%.
Important disclaimer
All findings on this page are MarkData opinion-survey responses. They are not official IEC election results, and they do not replace certified election outcomes.
Original MarkData panel graphics remain the approved source assets on this page.